Tag: 2020Q2

Eurostat. Secondo Trimestre. Pil -11.8% MoM, -14.7% YoY, Occupati -2.9% MoM.
Giuseppe Sandro Mela.
2020-09-08.

La Tabella dei pil allegata da Eurostat è spietata.
La colonna critica è l’ultima, ossia la comparazione tra i pil del secondo trimestre attuale con quello dell’anno precedente.
L’eurozona presenta un pil del secondo trimestre ridotto del -14.7%, contro un -13.9% della EU27, YoY.
Tutte le nazioni altamente industrializzate hanno valori fortemente negativi: Germania -11.3%, Francia -18.9%, Regno Unito -21.7%, Italia -17.7%, Spagna -22.1%.
«Compared to the fourth quarter of 2019, the number of hours worked was 16.4% lower in the euro area and 13.5% lower in the EU. These are the lowest levels since the beginning of the time series in 1995.»
A nostro personalissimo modo di vedere, questi dati non potrebbero permettere ottimismo alcuno.
*
Eurostat ha rilasciato il Report
GDP main aggregates and employment estimates for the second quarter of 2020. GDP down by 11.8% and employment down by 2.9% in the euro area. In the EU, GDP down by 11.4% and employment down by 2.7%.
GDP growth in the euro area and EU
In the second quarter of 2020, still marked by COVID-19 containment measures in most Member States, seasonally adjusted GDP decreased by 11.8% in the euro area and by 11.4% in the EU compared with the previous quarter, according to an estimate published by Eurostat, the statistical office of the European Union. These were by far the sharpest declines observed since the time series started in 1995. In the first quarter of 2020, GDP had decreased by 3.7% in the euro area and by 3.3% in the EU.
GDP growth by Member State
Among Member States for which data are available for the second quarter of 2020, Spain (-18.5%) recorded the sharpest decline of GDP compared to the previous quarter, followed by Croatia (-14.9%), Hungary (-14.5%), Greece (-14.0%), Portugal (-13.9%) and France (-13.8%). The lowest declines of GDP were observed in Finland (-4.5%), Lithuania (-5.5%) and Estonia (-5.6%), followed by Ireland (-6.1%), Latvia (-6.5%) and Denmark (-
GDP components and contributions to growth
During the second quarter of 2020, household final consumption expenditure decreased by 12.4% in the euro area and by 12.0% in the EU (after -4.5% in the euro area and -4.2% in the EU in the previous quarter). Gross fixed capital formation decreased by 17.0% in the euro area and by 15.4% in the EU (after -5.2% and -4.6% respectively). Exports decreased by 18.8% in both the euro area and the EU (after -3.9% and -3.2% respectively). Imports decreased by 18.0% in the euro area and by 17.8% in the EU (after -3.2% and -2.8% respectively).
Household final consumption expenditure had a very strong negative contribution to GDP growth in both the euro area and the EU (-6.6 and -6.3 percentage points – pp, respectively) and the contribution from gross fixed capital formation was also strongly negative in both zones (-3.8 and -3.4 pp respectively). The contributions from the external balance and government final expenditure were also negative in both zones, while the contribution of changes in inventories was slightly positive in the euro area and slightly negative in the EU.
GDP levels in the euro area and EU
The COVID-19 pandemic also had a strong impact on GDP levels. Based on seasonally adjusted figures, GDP volumes were significantly lower than the highest levels of the fourth quarter of 2019 (-15.1% in the euro area and -14.3% in the EU). This corresponds to the lowest levels since the the first quarter of 2005 for the euro area and the third quarter of 2009 for the EU. For the United States, GDP was 10.2% below the level of the fourth quarter of 2019, which is the lowest level since the fourth quarter of 2014.
Employment growth in the euro area and EU
The number of employed persons decreased by 2.9% in the euro area and by 2.7% in the EU in the second quarter of 2020, compared with the previous quarter. These were the sharpest declines observed since the time series started in 1995. In the first quarter of 2020, employment had decreased by 0.3% in the euro area and by 0.2% in the EU.
Compared with the same quarter of the previous year, employment decreased by 3.1% in the euro area and by 2.9% in the EU in the second quarter of 2020, after +0.4% in both zones in the first quarter of 2020. These were also the sharpest declines observed since the time series started in 1995.
While the impact of the COVID-19 pandemic on employment in persons was still relatively moderate due to government support schemes, declines in hours worked were much more pronounced. Hours worked decreased by 12.8% in the euro area and by 10.7% in the EU in the second quarter of 2020, compared with the previous quarter. Compared with the same quarter of the previous year the declines were 16.6% in the euro area and 13.8% in the EU respectively (see annex table on employment in hours worked). Both were by far the sharpest declines since the beginning of the time series.
These data provide a picture of labour input consistent with the output and income measure of national accounts.
Employment growth in Member States
In the second quarter of 2020, employment in persons decreased in all Member States compared with the previous quarter, except in Malta (+0.6%). The largest decreases were recorded in Spain (-7.5%), Ireland (-6.1%), Hungary (-5.3%) and Estonia (-5.1%).
The decrease in hours worked was generally much more pronounced for all Member States (see annex table on employment in hours worked).
Employment levels in the euro area and EU
Based on seasonally adjusted figures, Eurostat estimates that in the second quarter of 2020, 203.1 million people were employed in the EU, of which 155.6 million were in the euro area.
In relation to the COVID-19 pandemic, employment in persons decreased by 5.1 million in the euro area (-3.2%) and by 6.1 million (-2.9%) in the EU compared with the highest levels of the fourth quarter of 2019. These are the lowest levels since the first quarter of 2017 for both areas.
Compared to the fourth quarter of 2019, the number of hours worked was 16.4% lower in the euro area and 13.5% lower in the EU. These are the lowest levels since the beginning of the time series in 1995.
Evolution of labour productivity in the euro area and EU
The combination of GDP and employment data allows an estimation of labour productivity. The analysis of growth compared to the same quarter of the previous years shows that productivity growth (based on employed persons) fluctuated around 1% for both zones between 2013 and 2018.
In relation to the COVID-19 pandemic, there was a sharp decline in productivity based on persons in the first and second quarter of 2020 as GDP dropped sharply while the impact on employment in persons was still relatively moderate.
Based on hours worked the impact on productivity was limited. In the euro area there was a slight increase since hours worked dropped more sharply than GDP, contrary to the EU, where productivity declined slightly.
India. Pil 2020Q2 -23.9% anno su anno, Semine estive +21% anno su anno.
Giuseppe Sandro Mela.
2020-09-05.

«India’s economy shrinks record 23.9% y/y in June quarter»
«India’s economy contracted at its steepest pace on record of 23.9% in the June quarter as the pandemic lockdown cut consumer and business spending, putting pressure on the government and central bank for additional stimulus and a rate cut.»
«The gross domestic product (GDP) data INGDPQ=ECI released on Monday showed consumer spending, private investments and exports all collapsed during the world’s strictest lockdown imposed in late March to combat the COVID-19 pandemic»
«Prime Minister Narendra Modi announced a $266 billion stimulus package in May, including credit guarantees on bank loans and free food grains to poor people, but consumer demand and manufacturing have yet to recover»
«the economic slump was widely expected as India was under lockdown for almost half of the quarter»
«Data showed that manufacturing has already entered recession as the output fell 39.3% in June quarter after falling 1.4% in the previous quarter»
«However, with an annual growth of 3.4% in the April-June quarter, the farm sector, which accounts for 15% of economic output, gave some hope the rural economy will be able to support millions of migrant workers »
* * * * * * *
In effetti, l’agricoltura indiana presenta macrodati incoraggianti.
India. Agricoltura. Semine estive +21% rispetto l’anno precedente.
Heavy monsoon rains speed up crop planting in India.
India. Riserve Valutarie salite a 516.36 miliardi Usd.
India. Maggio. Rispetto ad Aprile, consumi benzina +81.8%, diesel +69.1%.
India. Modi. Una rivoluzione nella politica economica. ‘Self-reliant India’.
India. Pil Q1 annualizzato 4.2%. Ma il Q2 potrebbe essere negativo.
Tra due mesi saranno disponibili i macrodati relativi al terzo trimestre.
*
India’s economy shrinks record 23.9% y/y in June quarter.
India’s economy contracted at its steepest pace on record of 23.9% in the June quarter as the pandemic lockdown cut consumer and business spending, putting pressure on the government and central bank for additional stimulus and a rate cut.
The gross domestic product (GDP) data INGDPQ=ECI released on Monday showed consumer spending, private investments and exports all collapsed during the world’s strictest lockdown imposed in late March to combat the COVID-19 pandemic.
The read-out for the June quarter was worse than the 18.3% contraction forecast of analysts in a Reuters poll. It was also lower than a 3.1% growth rate for the previous quarter and upwardly-revised 5.2% growth in June quarter of 2019.
Some private economists have said the fiscal year that began in April could see a contraction of nearly 10%, the worst performance since India won independence from British colonial rule in 1947 and likely to push millions into poverty.
Prime Minister Narendra Modi announced a $266 billion stimulus package in May, including credit guarantees on bank loans and free food grains to poor people, but consumer demand and manufacturing have yet to recover.
Sujan Hajra, chief economist at Anand Rathi Securities, Mumbai, said the economic slump was widely expected as India was under lockdown for almost half of the quarter.
“This (GDP number) improves chances of rate cut in October slightly,” he said.
Data showed that manufacturing has already entered recession as the output fell 39.3% in June quarter after falling 1.4% in the previous quarter.
The number of novel coronavirus cases has been spreading in India faster than anywhere else in the world, with more than 3.6 million already infected and a death toll of over 64,400.
However, with an annual growth of 3.4% in the April-June quarter, the farm sector, which accounts for 15% of economic output, gave some hope the rural economy will be able to support millions of migrant workers who have returned to their villages.
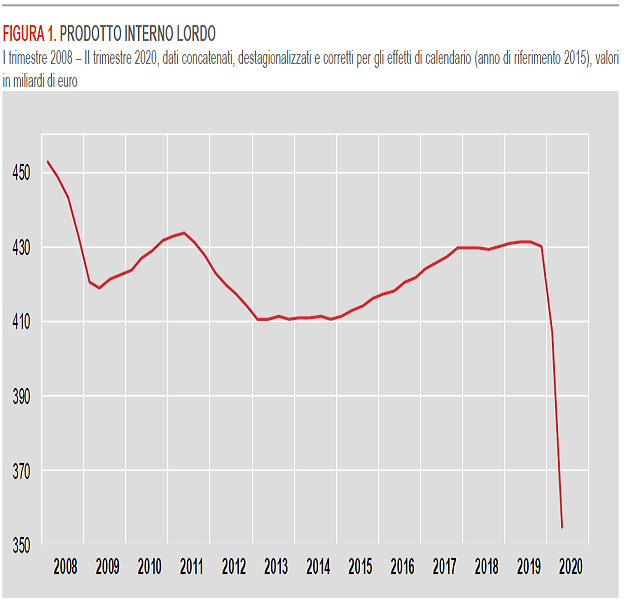
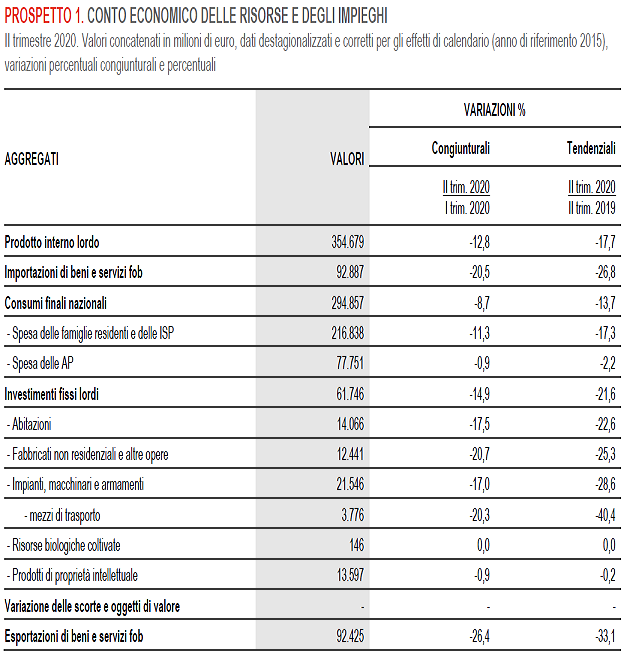
Italia. Istat. 2020Q2. Pil -12.8% QoQ, -17.7% YoY.
Giuseppe Sandro Mela.
2020-09-03.
In sintesi.
– Il pil è diminuito del 12,8% rispetto al trimestre precedente
– Il pil è diminuito del 17.7% rispetto allo stesso trimestre dell’anno precedente
– cali dell’8,7% per i consumi finali nazionali
– cali del 14,9% per gli investimenti fissi lordi
– Le importazioni e le esportazioni sono diminuite, rispettivamente, del 20,5% e del 26,4%.
* * * * * * *
Il commento
La stima completa dei conti economici trimestrali conferma la portata eccezionale della diminuzione del Pil nel secondo trimestre per gli effetti economici dell’emergenza sanitaria e delle misure di contenimento adottate, con flessioni del 12,8% in termini congiunturali e del 17,7% in termini tendenziali, mai registrate dal 1995. Nella stima preliminare il calo congiunturale era pari al 12,4%. A trascinare la caduta del Pil è stata soprattutto la domanda interna, con un apporto particolarmente negativo dei consumi privati e contributi negativi rilevanti di investimenti e variazione delle scorte. Anche la domanda estera ha fornito un apporto negativo, per la riduzione delle esportazioni più decisa di quella delle importazioni. La contrazione dell’attività produttiva si è accompagnata a una marcata riduzione dell’input di lavoro in termini di ULA e ore lavorate, mentre le posizioni lavorative hanno subito un calo meno marcato.
* * * * * * *
«Nel secondo trimestre, il Pil è diminuito in termini congiunturali del 9,1% negli Stati Uniti, del 13,8% in Francia e del 9,7% in Germania. In termini tendenziali, si è registrata una diminuzione del 9,1% negli Stati Uniti, dell’11,3% in Germania e del 19% in Francia. Nel complesso, il Pil dei paesi dell’area Euro è diminuito del 12,1% rispetto al trimestre precedente e del 15% nel confronto con il secondo trimestre del 2019 »
«La diminuzione degli investimenti è stata determinata dalla riduzione del 17% della spesa per impianti, macchinari e armamenti, del 20,3% della componente di mezzi di trasporto, dello 0,9% dei prodotti di proprietà intellettuale; gli investimenti in abitazioni e fabbricati non residenziali e altre opere sono scesi, rispettivamente, del 17,5% e del 20,7%.»
«La spesa delle famiglie sul territorio economico ha registrato una diminuzione in termini congiunturali del 12,4% (si veda la tabella 13 allegata). In particolare, gli acquisti di beni durevoli sono diminuiti del 21,4%, quelli di beni non durevoli del 4,4%, quelli di servizi del 15,8% e quelli di beni semidurevoli del 15,1%.»
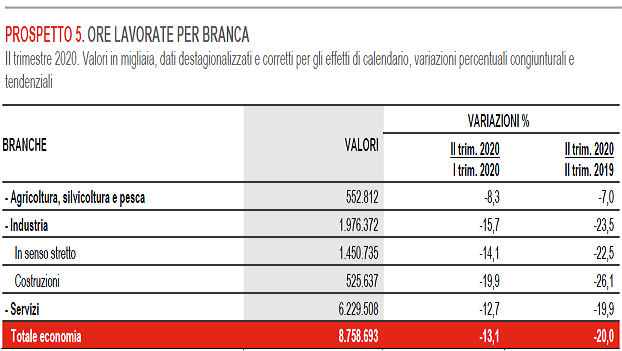
«Nel secondo trimestre del 2020 le ore lavorate hanno registrato un diminuzione del 13,1% rispetto al trimestre precedente. Questo risultato è dovuto a cali dell’8,3% dell’agricoltura, silvicoltura e pesca, del 14,1% dell’industria in senso stretto e del 19,9% delle costruzioni, mentre i servizi registrano una riduzione del 12,7%.»
«Le unità di lavoro sono diminuite dell’11,8% per effetto di un calo generalizzato in agricoltura, silvicoltura e pesca, industria in senso stretto, costruzioni e servizi pari, rispettivamente, a -3%, -17,2%, -23,1% e -10,4%.»
* * * * * * *
Questi sono dati da obitorio.
La ripresa più lontana del più remoto buco nero. Solo un ministro prevede un Q3 da urlo di gioia.
*
Istat. Conti economici trimestrali. [Full text]
Nel secondo trimestre del 2020 il prodotto interno lordo (Pil), espresso in valori concatenati con anno di riferimento 2015, corretto per gli effetti di calendario e destagionalizzato, è diminuito del 12,8% rispetto al trimestre precedente e del 17,7% nei confronti del secondo trimestre del 2019.
La stima preliminare della variazione congiunturale del Pil diffusa il 31 luglio 2020 era stata del -12,4% mentre quella tendenziale del -17,3%.
Il secondo trimestre del 2020 ha avuto una giornata lavorativa in meno sia rispetto al trimestre precedente sia nei confronti del secondo trimestre del 2019.
La variazione acquisita per il 2020 è pari a -14,7%.
Rispetto al trimestre precedente, tutti i principali aggregati della domanda interna sono in diminuzione, con cali dell’8,7% per i consumi finali nazionali e del 14,9% per gli investimenti fissi lordi. Le importazioni e le esportazioni sono diminuite, rispettivamente, del 20,5% e del 26,4%.
La domanda nazionale al netto delle scorte ha contribuito per -9,5 punti percentuali alla contrazione del Pil, con -6,7 punti dei consumi delle famiglie e delle Istituzioni Sociali Private ISP, -2,6 punti degli investimenti fissi lordi e -0,2 punti della spesa delle Amministrazioni Pubbliche (AP). Anche la variazione delle scorte e la domanda estera netta hanno contribuito negativamente alla variazione del Pil, rispettivamente per -0,9 e -2,4 punti percentuali.
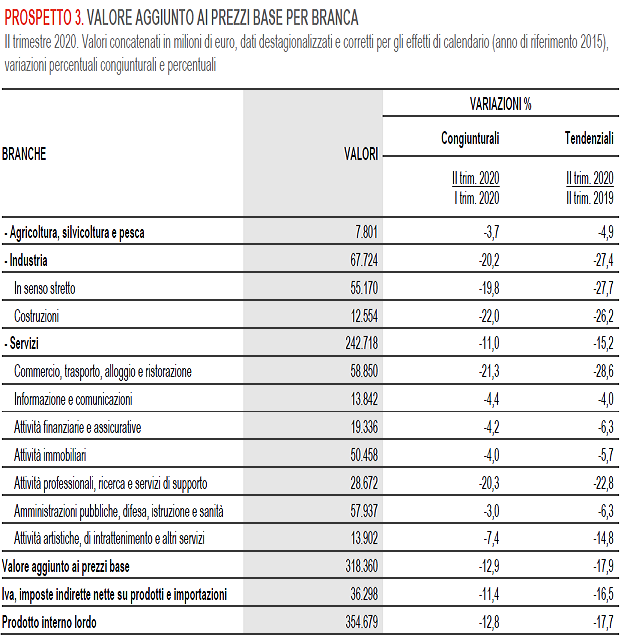
Si registrano andamenti congiunturali negativi per il valore aggiunto in tutti i principali comparti produttivi, con agricoltura, industria e servizi diminuiti, rispettivamente, del 3,7%, del 20,2% e dell’11%.
Italia. Istat. Secondo Trimestre. Fatturato Servizi quasi azzerato in molti settori.
Giuseppe Sandro Mela.
2020-09-02.

In sintesi.
– Servizi. Fatturato. 2020Q2. -21.0% rispetto al trimestre precedente
– Servizi. Fatturato. 2020Q2. -26.2% rispetto il dato dell’anno precedente.

*

«Nel secondo trimestre 2020 le condizioni della domanda e le misure di contenimento dell’epidemia di Covid-19 determinano un calo senza precedenti degli indici del fatturato delle imprese dei servizi»
«La flessione registrata nel secondo trimestre, in termini sia congiunturali (-21,0%) sia tendenziali (-26,2%), è la peggiore dall’inizio delle serie storiche (disponibili dal 2001).»

Alcuni settori sono stati quasi annientati.
– Attività delle agenzie di viaggio -93.0%
– Alloggio -88.3%
– Trasporto aereo -79.1%
– Attività dei servizi di ristorazione -64.2%
– Commercio di autoveicoli -43.9%
* * * * * * *
Sono tutti servizi di cruciale importanza, letteralmente rovinati da scriteriate operazioni di governo.
Se gli effetti sono immediati, nei termini di fatturato falcidiato, quelli futuri si preannunciano ancora peggiori: il gettito fiscale ed i versamenti previdenziali nel prossimo avvenire crolleranno anche essi. Sarà molto difficile in simile frangente garantire il pagamento delle pensioni e degli stipendi ai pubblici dipendenti.
L’Italia si avvia velocemente verso la società della miseria.
*
Istat. Fatturato dei servizi
Nel secondo trimestre 2020 l’indice destagionalizzato del fatturato dei servizi diminuisce del 21,0% rispetto al trimestre precedente; l’indice generale grezzo registra una diminuzione, in termini tendenziali, del 26,2%.
L’indice del fatturato dei servizi nel secondo trimestre 2020 registra variazioni congiunturali negative in tutti i settori, specialmente quelli più direttamente colpiti dall’emergenza sanitaria. Le Attività dei servizi di alloggio e ristorazione mostrano un crollo del 62,6%. Forti cali contraddistinguono anche le Agenzie di viaggio e servizi di supporto alle imprese (-30,7%), il Trasporto e magazzinaggio (-27,8%) e le Attività professionali, scientifiche e tecniche (-23,2%). Flessioni ampie, seppure più contenute, caratterizzano il Commercio all’ingrosso, commercio e riparazione di autoveicoli e motocicli (-16,3%) e i Servizi di informazione e comunicazione (-6,7%).
Nel secondo trimestre 2020 si registrano diminuzioni tendenziali per le Attività dei servizi di alloggio e ristorazione (-71,4%), le Agenzie di viaggio e i servizi di supporto alle imprese (-33,9%), il Trasporto e magazzinaggio (-30,7%), le Attività professionali, scientifiche e tecniche (-24,0%), il Commercio all’ingrosso, commercio e riparazione di autoveicoli e motocicli (-21,8%) e infine per i Servizi di informazione e comunicazione (-8,1%).
Il commento
Nel secondo trimestre 2020 le condizioni della domanda e le misure di contenimento dell’epidemia di Covid-19 determinano un calo senza precedenti degli indici del fatturato delle imprese dei servizi. La flessione registrata nel secondo trimestre, in termini sia congiunturali (-21,0%) sia tendenziali (-26,2%), è la peggiore dall’inizio delle serie storiche (disponibili dal 2001). I cali del fatturato hanno colpito tutti i settori rilevati, risultando particolarmente marcati in quelle attività maggiormente interessate dai provvedimenti di chiusura per il contenimento dell’emergenza sanitaria, quali quelle legate alla filiera del turismo (Attività delle agenzie di viaggio -93,0%, Alloggio -88,3%, Trasporto aereo -79,1%, Attività dei servizi di ristorazione -64,2%) e del commercio di autoveicoli (-43,9%) .
Giappone. 2020Q2. Spese per investimenti (Annuale) -11.3%, previsto +4.3%.
Giuseppe Sandro Mela.
2020-09-01.

La Spesa di capitale misura il cambiamento nelle spese di capitale effettuate dalle aziende.
Si tratta di un indicatore chiave delle condizioni aziendali e della salute economica.
Il dato misura il cambiamento di quel trimestre con quello dello stesso trimestre dell’anno precedente.
*
Si notino due elementi.
– Senza investimenti la produzione langue
– Le previsioni degli economisti sono totalmente sballate. Conveniamo che una previsione non la si neghi a nessuno, ma almeno si azzecchi se sia positiva o negativa!
Oecd (Ocse). Secondo Trimestre pil -9.8%. Ripresa molto lotana.
Giuseppe Sandro Mela.
2020-08-26.

La Organization for Economic Co-operation and Development, Oecd (Ocse), ha rilasciato un ponderoso studio sulla attuale situazione economica del blocco:
Facing the jobs crisis. OECD Employment Outlook 2020.
«Many countries are using job retention programmes to help keep workers employed and save viable jobs. These include measures that directly subsidise hours not worked, such as Germany’s Kurzarbeit or France’s Activité partielle, as well as measures that also top up the earnings of workers on reduced hours, such as The Netherland’s NOW (Noodmatregel Overbrugging Werkgelegenheid) or the Job Keeper Payment in Australia. About 60 million people across the OECD have been included in company claims for such programmes.»
Si faccia molta attenzione.
Molti stati del blocco europeo considerano ‘occupati’ ai fini statistici anche quei lavoratori che, pur non essendo stati licenziati formalmente, ricevono uno stipendio solo grazie a sussidi governativi.

* * * * * * *
Ocse: Calo del Pil senza precedenti, -9,8% ad aprile-giugno
Con la crisi della finanza fu del 2,3%. Uk crolla del 20,4%, Italia terza.
Un calo del Pil ”senza precedenti’: nel secondo trimestre del 2020 l’economia dell’Ocse, che riunisce i principali Paesi industrializzati, si è contratta del 9,8% contro l’1,8% dei primi tre mesi dell’anno. Lo annuncia l’Ocse in una nota nella quale spiega che il dato, dovuto all’introduzione delle misure di contenimento del coronavirus Covid 19, registra “la più grande caduta mai registrata dal Pil dell’area Ocse, significativamente maggiore del -2,3% segnato nel primo trimestre del 2009, nel picco negativo della crisi finanziaria”.
Il Pil è “caduto in modo maggiormente drammatico” nel Regno Unito, che ha segnato un calo del 20,4%, seguito dalla Francia (-13,8) e, nella terza peggiore posizione, dall’Italia (-12,4%). Negli Usa, che domani renderanno noti gli ultimi dati di Pil, viene stimato un calo appena meno forte: -9,5%.
*
Eurostat says Q2 GDP down by 11.7 pct in EU, 12.1 pct in euro area.
(Xinhua) — The gross domestic product (GDP) in the second quarter of 2020 decreased by 11.7 percent in the European Union (EU) and by 12.1 percent in the euro area compared with the previous quarter, Eurostat said in its flash estimates on Friday.
The estimates said the figures were by far the sharpest declines observed since time series started in 1995. Eurostat attributed the downturn to the COVID-19 containment measures still in place in most EU member states.
In the first quarter of 2020, GDP had decreased by 3.2 percent in the EU and by 3.6 percent in the euro area.
When compared with the second quarter of 2019, the figures declined by 14.1 percent in the EU and by 15.0 percent in the euro area respectively.
Eurostat said the number of employed persons decreased by 2.6 percent in the EU and by 2.8 percent in the euro area in the second quarter, compared with the previous quarter. These were also the sharpest declines observed since 1995.
In the first quarter of 2020, employment had decreased by 0.1 percent in the EU and by 0.2 percent in the euro area.
Eurozona. Pil Q2. -12.1% QoQ, -15.0% YoY. Occupati -2.8%.
Giuseppe Sandro Mela.
2020-08-14.


In sintesi:
– Eurozona. Pil 2020Q2. -12.1% trimestre su trimestre, QoQ.
– Eurozona. Pil 2020Q2. -15.0% anno su anno, YoY
– Eurozona. 2020Q2. Occupati -2.8%; EU27 -2.6%, QoQ
These were by far the sharpest declines observed since time series started in 1995.

Per comparazione, il Pil 2020Q2 della Cina valeva +3.2%. Stesso Covid, diversi i governi.
*
Eurostat ha rilasciato il Report
GDP and employment flash estimates for the second quarter of 2020: GDP down by 12.1% and employment down by 2.8% in the euro area.
GDP down by 12.1% and employment down by 2.8% in the euro area
In the EU, GDP down by 11.7% and employment down by 2.6%
GDP growth in the euro area and EU
In the second quarter of 2020, still marked by COVID-19 containment measures in most Member States, seasonally adjusted GDP decreased by 12.1% in the euro area and by 11.7% in the EU compared with the previous quarter, according to a flash estimate published by Eurostat, the statistical office of the European Union. These were by far the sharpest declines observed since time series started in 1995. In the first quarter of 2020, GDP had decreased by 3.6% in the euro area and by 3.2% in the EU.
Compared with the same quarter of the previous year, seasonally adjusted GDP decreased by 15.0% in the euro area and by 14.1% in the EU in the second quarter of 2020, after -3.1% and -2.5% respectively in the previous quarter. These were also by far the sharpest declines since time series started in 1995.
During the second quarter of 2020, GDP in the United States decreased by 9.5% compared with the previous quarter (after -1.3% in the first quarter of 2020). Compared with the same quarter of the previous year, GDP decreased by 9.5% (after +0.3% in the previous quarter).
Employment growth in the euro area and EU
The number of employed persons decreased by 2.8% in the euro area and by 2.6% in the EU in the second quarter of 2020, compared with the previous quarter. These were the sharpest declines observed since time series started in 1995. In the first quarter of 2020, employment had decreased by 0.2% in the euro area and by 0.1% in the EU.
Compared with the same quarter of the previous year, employment decreased by 2.9% in the euro area and by 2.7% the EU in the second quarter of 2020, after +0.4% in both zones in the first quarter of 2020. These were also the sharpest declines observed since time series started in 1995.
Thailandia. Q2. Segni di ripresa. Consumi +6%, investimenti +5.7%.
Giuseppe Sandro Mela.
2020-08-05.

«Thailand’s economy may have shrank by 12%-13% in the second quarter from a year earlier due to the impacts of the coronavirous pandemic, the central bank said on Friday»
«However, the economy had improved in June from the previous month following the easing of a lockdown to curb the spread, which has battered tourism and domestic activity»
«The second quarter probably shrank the deepest in history»
«At this point, we still look at a double-digit contraction, possibly minus 12%-13%»
«Thailand registered a record economic contraction of 12.5% in the second quarter of 1998, during the Asian financial crisis»
«official gross domestic product (GDP) data for April-June, which is due on Aug. 17, might be better than the BOT’s estimates given the latest improved economic indicators»
«The BOT has forecast Southeast Asia’s second-largest economy will contract by a record 8.1% this year»
«Exports, a key driver of growth, dropped 24.6% in June from a year earlier, after May’s 23.6% decline»
«In June, private consumption rose 6% from the previous month while investment increased 5.7%»
* * * * * * *
La Thailandia, ex Siam, è un paese di 69.7 milioni di abitanti, con un pil ppa procapite di 15,579 Usd.
«Nel corso del 2013 il tasso di disoccupazione è risultato inferiore all’1%.
Quasi il 70% dell’intera popolazione thailandese è costituito da agricoltori, che coltivano una terra alluvionale così ricca che la Thailandia è al primo posto nel mondo per l’esportazione di tapioca, al secondo per quella di riso e di caucciù, al terzo per quella di ananas in scatola. Inoltre questo paese è tra i principali esportatori di zucchero, granoturco e stagno. In via di sviluppo sono l’industria dell’abbigliamento e l’elettronica. In via di incremento il turismo internazionale che si concentra, in particolar modo, nella zona costiera. ….
Gli sviluppi in agricoltura dal 1960 hanno sostenuto la transizione della Thailandia verso un’economia industrializzata. Nel 2008 l’agricoltura, silvicoltura e pesca hanno contribuito 8,4 per cento del PIL; nelle zone rurali, i lavori agricoli forniscono lavoro. La Thailandia è uno dei primi esportatori mondiali di riso, e un grande esportatore di gamberetti. Altre coltivazioni includono noci di cocco, mais, gomma, soia, canna da zucchero e tapioca. ….
Tra il 1992 e il 2001 le esportazioni di tronchi e legname sono aumentate da 50.000 a 2.000.000 di metri cubi all’anno ….
Nel 2007 l’industria ha contribuito con il 43,9% del PIL, impiegando il 14% della forza lavoro. L’industria è cresciuta a un tasso medio annuo del 3,4% nel periodo 1995-2005. ….
La Thailandia sta diventando un centro per la produzione di automobili per l’Associazione delle Nazioni del Sud-est asiatico (ASEAN) di mercato. Nel 2004 la produzione di automobili ha raggiunto 930.000 unità, più del doppio di quanto nel 2001. Toyota e Ford sono attive in Thailandia, e l’espansione del settore automobilistico ha aumentato la produzione di acciaio nazionale. ….
Il turismo fornisce un contributo grande per l’economia della Thailandia (circa il 6% del PIL)» [Fonte]
* * * * * * *
La stasi dei commerci internazionali dovuta alla crisi da coronavirus ha fortemente penalizzato il sistema economico thailandese, ma la ripresa dei consumi interni (+6%) e degli investimenti (+5.7%) lascerebbero intravedere segni di ripresa.
Di conseguenza, il calo del -12% del pil del secondo trimestre sembrerebbe poter essere facilmente ammortizzabile a tempi brevi.
*
Thailand second quarter economy likely shrank by record 12%-13% year-on-year: central bank. – Reuters.
Thailand’s economy may have shrank by 12%-13% in the second quarter from a year earlier due to the impacts of the coronavirous pandemic, the central bank said on Friday, in what could be a record contraction.
However, the economy had improved in June from the previous month following the easing of a lockdown to curb the spread, which has battered tourism and domestic activity.
“The economy should have bottomed out. The second quarter probably shrank the deepest in history,” Don Nakornthab, a director at the Bank of Thailand (BOT), told a briefing.
“At this point, we still look at a double-digit contraction, possibly minus 12%-13%,” he said.
Thailand registered a record economic contraction of 12.5% in the second quarter of 1998, during the Asian financial crisis.
Don said official gross domestic product (GDP) data for April-June, which is due on Aug. 17, might be better than the BOT’s estimates given the latest improved economic indicators.
“If the actual data is better than expected, there is a chance that the BOT will revise up its estimates when it reviews them in September,” he said.
The BOT has forecast Southeast Asia’s second-largest economy will contract by a record 8.1% this year.
In June, private consumption rose 6% from the previous month while investment increased 5.7%.
Exports, a key driver of growth, dropped 24.6% in June from a year earlier, after May’s 23.6% decline.
Italia. Q2. Vendite Dettaglio. Q2 vs Q1 -8.8%, -2.2% anno su anno.
Giuseppe Sandro Mela.
2020-08-01.

In sintesi.
– Italia. Vendite Dettaglio. Q2 contro Q1 -7.9% in valore e -8.8% in volume
– Italia. Vendite Dettaglio. Giugno 2020 contro giugno 2019 -1.8% (grande distribuzione) e -6.4% (piccola distribuzione)
*
Una ragionevole ripresa delle vendite al dettaglio potrebbe essere foriera di un miglioramento della situazione economica nazionale.

*

*

*

*
