Giuseppe Sandro Mela.
2021-09-11.
Molto correttamente, Eurostat riporta le variazioni percentuali sul trimestre precedente.
Infatti, il 2020Q2 fu particolarmente depresso, per cui il rapporto 2021Q2/2020Q2 risulta essere abnormemente elevato, inaffidabile.
Sempre molto correttamente, Eurostat paragona questi macrodati con quelli del 2019Q4, ultimo trimestre prima della crisi pandemica.
«Based on seasonally adjusted figures, GDP volumes were 2.5% and 2.2% below their highest level of the fourth quarter 2019 for the euro area and EU. For the United States, GDP was 0.8% higher than the level of the fourth quarter 2019»
«employment in persons was 2.1 million in the euro area and 2.0 million in the EU below the level of the fourth quarter of 2019»
* * * * * * *
Eurostat ha rilasciato il Report GDP up by 2.2% and employment up by 0.7% in the euro area. In the EU, GDP up by 2.1% and employment up by 0.7%
GDP growth in the euro area and the EU
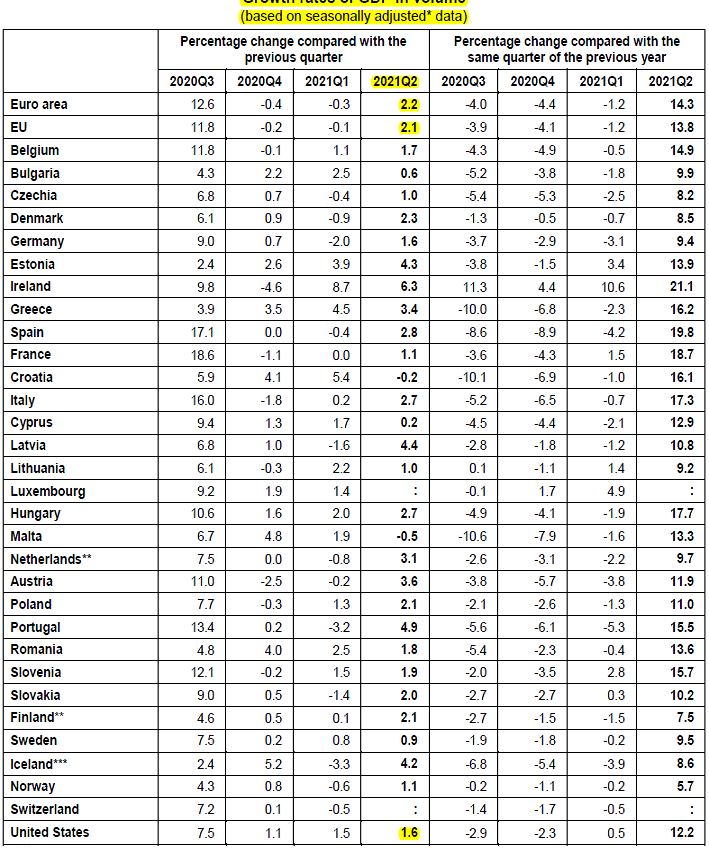
In the second quarter of 2021, seasonally adjusted GDP increased by 2.2% in the euro area and by 2.1% in the EU compared with the previous quarter, according to an estimate published by Eurostat, the statistical office of the European Union. In the first quarter of 2021, GDP had declined by 0.3% in the euro area and 0.1% in the EU.
Compared with the same quarter of the previous year, seasonally adjusted GDP increased by 14.3% in the euro area and by 13.8% in the EU in the second quarter of 2021, after -1.2% in both zones in the previous quarter.
During the second quarter of 2021, GDP in the United States increased by 1.6% compared with the previous quarter (after +1.5% in the first quarter of 2021). Compared with the same quarter of the previous year, GDP increased by 12.2% (after +0.5% in the previous quarter).
GDP growth by Member State
Ireland (+6.3%) recorded the sharpest increase of GDP compared to the previous quarter, followed by Portugal (+4.9%), Latvia (+4.4%) and Estonia (+4.3%). Declines were observed in Malta (-0.5%) and Croatia (-0.2%).
GDP components and contributions to growth
During the second quarter of 2021, household final consumption expenditure increased by 3.7% in the euro area and by 3.5% in the EU (after -2.1% in the euro area and -1.7% in the EU in the previous quarter). Government final consumption expenditure increased by 1.2% in both zones (after -0.5% both in the previous quarter). Gross fixed capital formation increased by 1.1% in the euro area and by 1.0% in the EU (after -0.2% and +0.3% respectively). Exports increased by 2.2% in the euro area and by 1.8% the EU (after +0.7% in both areas). Imports increased by 2.3% in the euro area and by 2.2% in the EU (after +0.4% and +0.6%).
Household final consumption expenditure had strong positive contributions to GDP growth in both the euro area and the EU (+1.9 and +1.7 percentage points – pp, respectively). The contributions from government final expenditure (+0.3 pp in both zones) and gross fixed capital formation (+0.2 pp in both zones) were also positive. The contribution from the external balance was close to neutral for both zones, while the contribution from changes in inventories was slightly negative for the euro area and neutral for the EU.
GDP levels in the euro area and EU
Based on seasonally adjusted figures, GDP volumes were 2.5% and 2.2% below their highest level of the fourth quarter 2019 for the euro area and EU. For the United States, GDP was 0.8% higher than the level of the fourth quarter 2019.
Employment growth in the euro area and EU
The number of employed persons increased by 0.7% in both the euro area and in the EU in the second quarter of 2021, compared with the previous quarter. In the first quarter of 2021, employment had decreased by 0.2% in both the euro area and the EU.
Compared with the same quarter of the previous year, employment increased by 1.8% in the euro area and by 1.9% in the EU in the second quarter of 2021, after -1.8% and -1.6% respectively in the first quarter of 2021.
Hours worked increased by 2.7% in the euro area and by 2.4% in the EU in the second quarter of 2021, compared with the previous quarter. Compared with the same quarter of the previous year the increases were 17.0% in the euro area and 14.7% in the EU (see annex table on employment in hours worked).
These data provide a picture of labour input consistent with the output and income measure of national accounts.
Employment growth in Member States
In the second quarter of 2021, Latvia (+5.7%), Greece (+2.8%), Denmark and Portugal (both +1.9%) recorded the highest growth of employment in persons compared with the previous quarter. Decreases were observed in Estonia (-1.1%) and Spain (-0.9%).
Employment levels in the euro area and EU
Based on seasonally adjusted figures, Eurostat estimates that in the second quarter of 2021, 207.5 million people were employed in the EU, of which 159.0 million were in the euro area.
In relation to the COVID-19 pandemic, employment in persons was 2.1 million in the euro area and 2.0 million in the EU below the level of the fourth quarter of 2019.
Evolution of labour productivity in the euro area and EU
The combination of GDP and employment data allows an estimation of labour productivity. The analysis of growth compared to the same quarter of the previous year shows that productivity growth (based on employed persons) fluctuated around 1% for both zones between 2013 and 2018.
In relation to the COVID-19 pandemic, productivity based on persons increased compared to the same quarter of the previous year with 12.2% for the euro area and 11.6% for the EU.
Based on hours worked, productivity compared to the same quarter of the previous year decreased by 1.5% for the euro area and increased by 0.3% for the EU.
